The vector database was innocent
I built a RAG service over the OpenTelemetry docs, then pointed OpenTelemetry back at it to find out why answers took 16 seconds. It wasn't the LLM. It wasn't the vector search either.
By Meet Modi
A ten-word question took 16.7 seconds to answer. The LLM, the component everyone bills as the slow part, was responsible for less than a third of that. The real culprit was the one span in the trace I had never bothered to suspect.
The setup, briefly
This started as an entry for the SigNoz hackathon's early round: self-host SigNoz, wire it up as your observability backend, send it real data, write about what you find. I wanted a workload that would produce honest telemetry, so I built ragdoll, a small RAG service that answers questions about the OpenTelemetry docs. RAG, if you haven't met it, is the pattern behind every 'chat with your docs' product: fetch the passages relevant to a question, hand them to a language model, let it answer with receipts. There was something circular here I couldn't resist. The docs about tracing became the thing I traced.
Everything runs on my M1 Pro, no API keys anywhere. Express on Node 22. Postgres with pgvector in Docker, holding 4,396 chunks of the OTel docs plus the SigNoz repo's markdown. Ollama serving nomic-embed-text for embeddings and llama3.2:3b for generation. SigNoz, self-hosted, catching everything.
One thing worth knowing before you try this: every tutorial that says clone the SigNoz repo and docker-compose up from deploy/ is now wrong. The compose manifests are gone and install.sh just prints a deprecation notice and exits 0. SigNoz installs through Foundry now, a CLI that treats the whole stack as config:
curl -fsSL https://signoz.io/foundry.sh | bash

cat > casting.yaml <<EOF
apiVersion: v1alpha1
kind: Installation
metadata:
  name: signoz
spec:
  deployment:
    flavor: compose
    mode: docker
EOF

foundryctl cast -f casting.yaml
One cast later: six containers idling at about 635 MB total, the UI on localhost:8080, an OTLP ingester on 4317. Under a minute, most of it image pulls. The port every older tutorial mentions (3301) is gone too, which is how you can tell who actually ran this recently.
Instrumenting the pipeline
A RAG request is three hops: embed the question (turn it into a list of numbers so similar text lands near similar text), search the stored chunks for the nearest neighbors, then stuff the winners into a prompt and generate. OpenTelemetry auto-instrumentation covers Express, the pg driver and outgoing HTTP without being asked. The two AI hops get manual spans carrying gen_ai attributes.
The detail that paid for itself later: Ollama's response includes a timing confession. How long it spent loading the model, reading the prompt, writing the answer. I copied those numbers straight onto the span.
const data = await post("/api/generate", {
  model: "llama3.2:3b", prompt, stream: false,
});
span.setAttributes({
  "gen_ai.usage.input_tokens": data.prompt_eval_count,
  "gen_ai.usage.output_tokens": data.eval_count,
  "ollama.load_duration_ms": Math.round(data.load_duration / 1e6),
  "ollama.prompt_eval_ms": Math.round(data.prompt_eval_duration / 1e6),
  "ollama.eval_ms": Math.round(data.eval_duration / 1e6),
});
Pino logs and two custom metrics ride the same OTLP endpoint, so traces, logs and metrics land in one place with trace IDs linking them. Quick decoder ring if tracing is new to you: a trace is the biography of one request, every step it takes is a span with a duration and whatever facts you attach, and spans stacked on a timeline make a waterfall. That's the entire vocabulary this post needs.
The first trace confirmed my prejudice
Cold start, first question: 7.7 seconds, and the chat span owned 7.5 of them. The span attributes broke it down further: 3.1 seconds loading the model, 1.2 reading 568 prompt tokens, 3.2 generating 159 output tokens. Fine. Prior confirmed, the LLM is the slow part, everyone can go home.
Then I asked a second question, expecting the warm run to be quicker. 16.7 seconds. The warm request was slower than the cold one, which is not how caching is supposed to work.
The waterfall names names
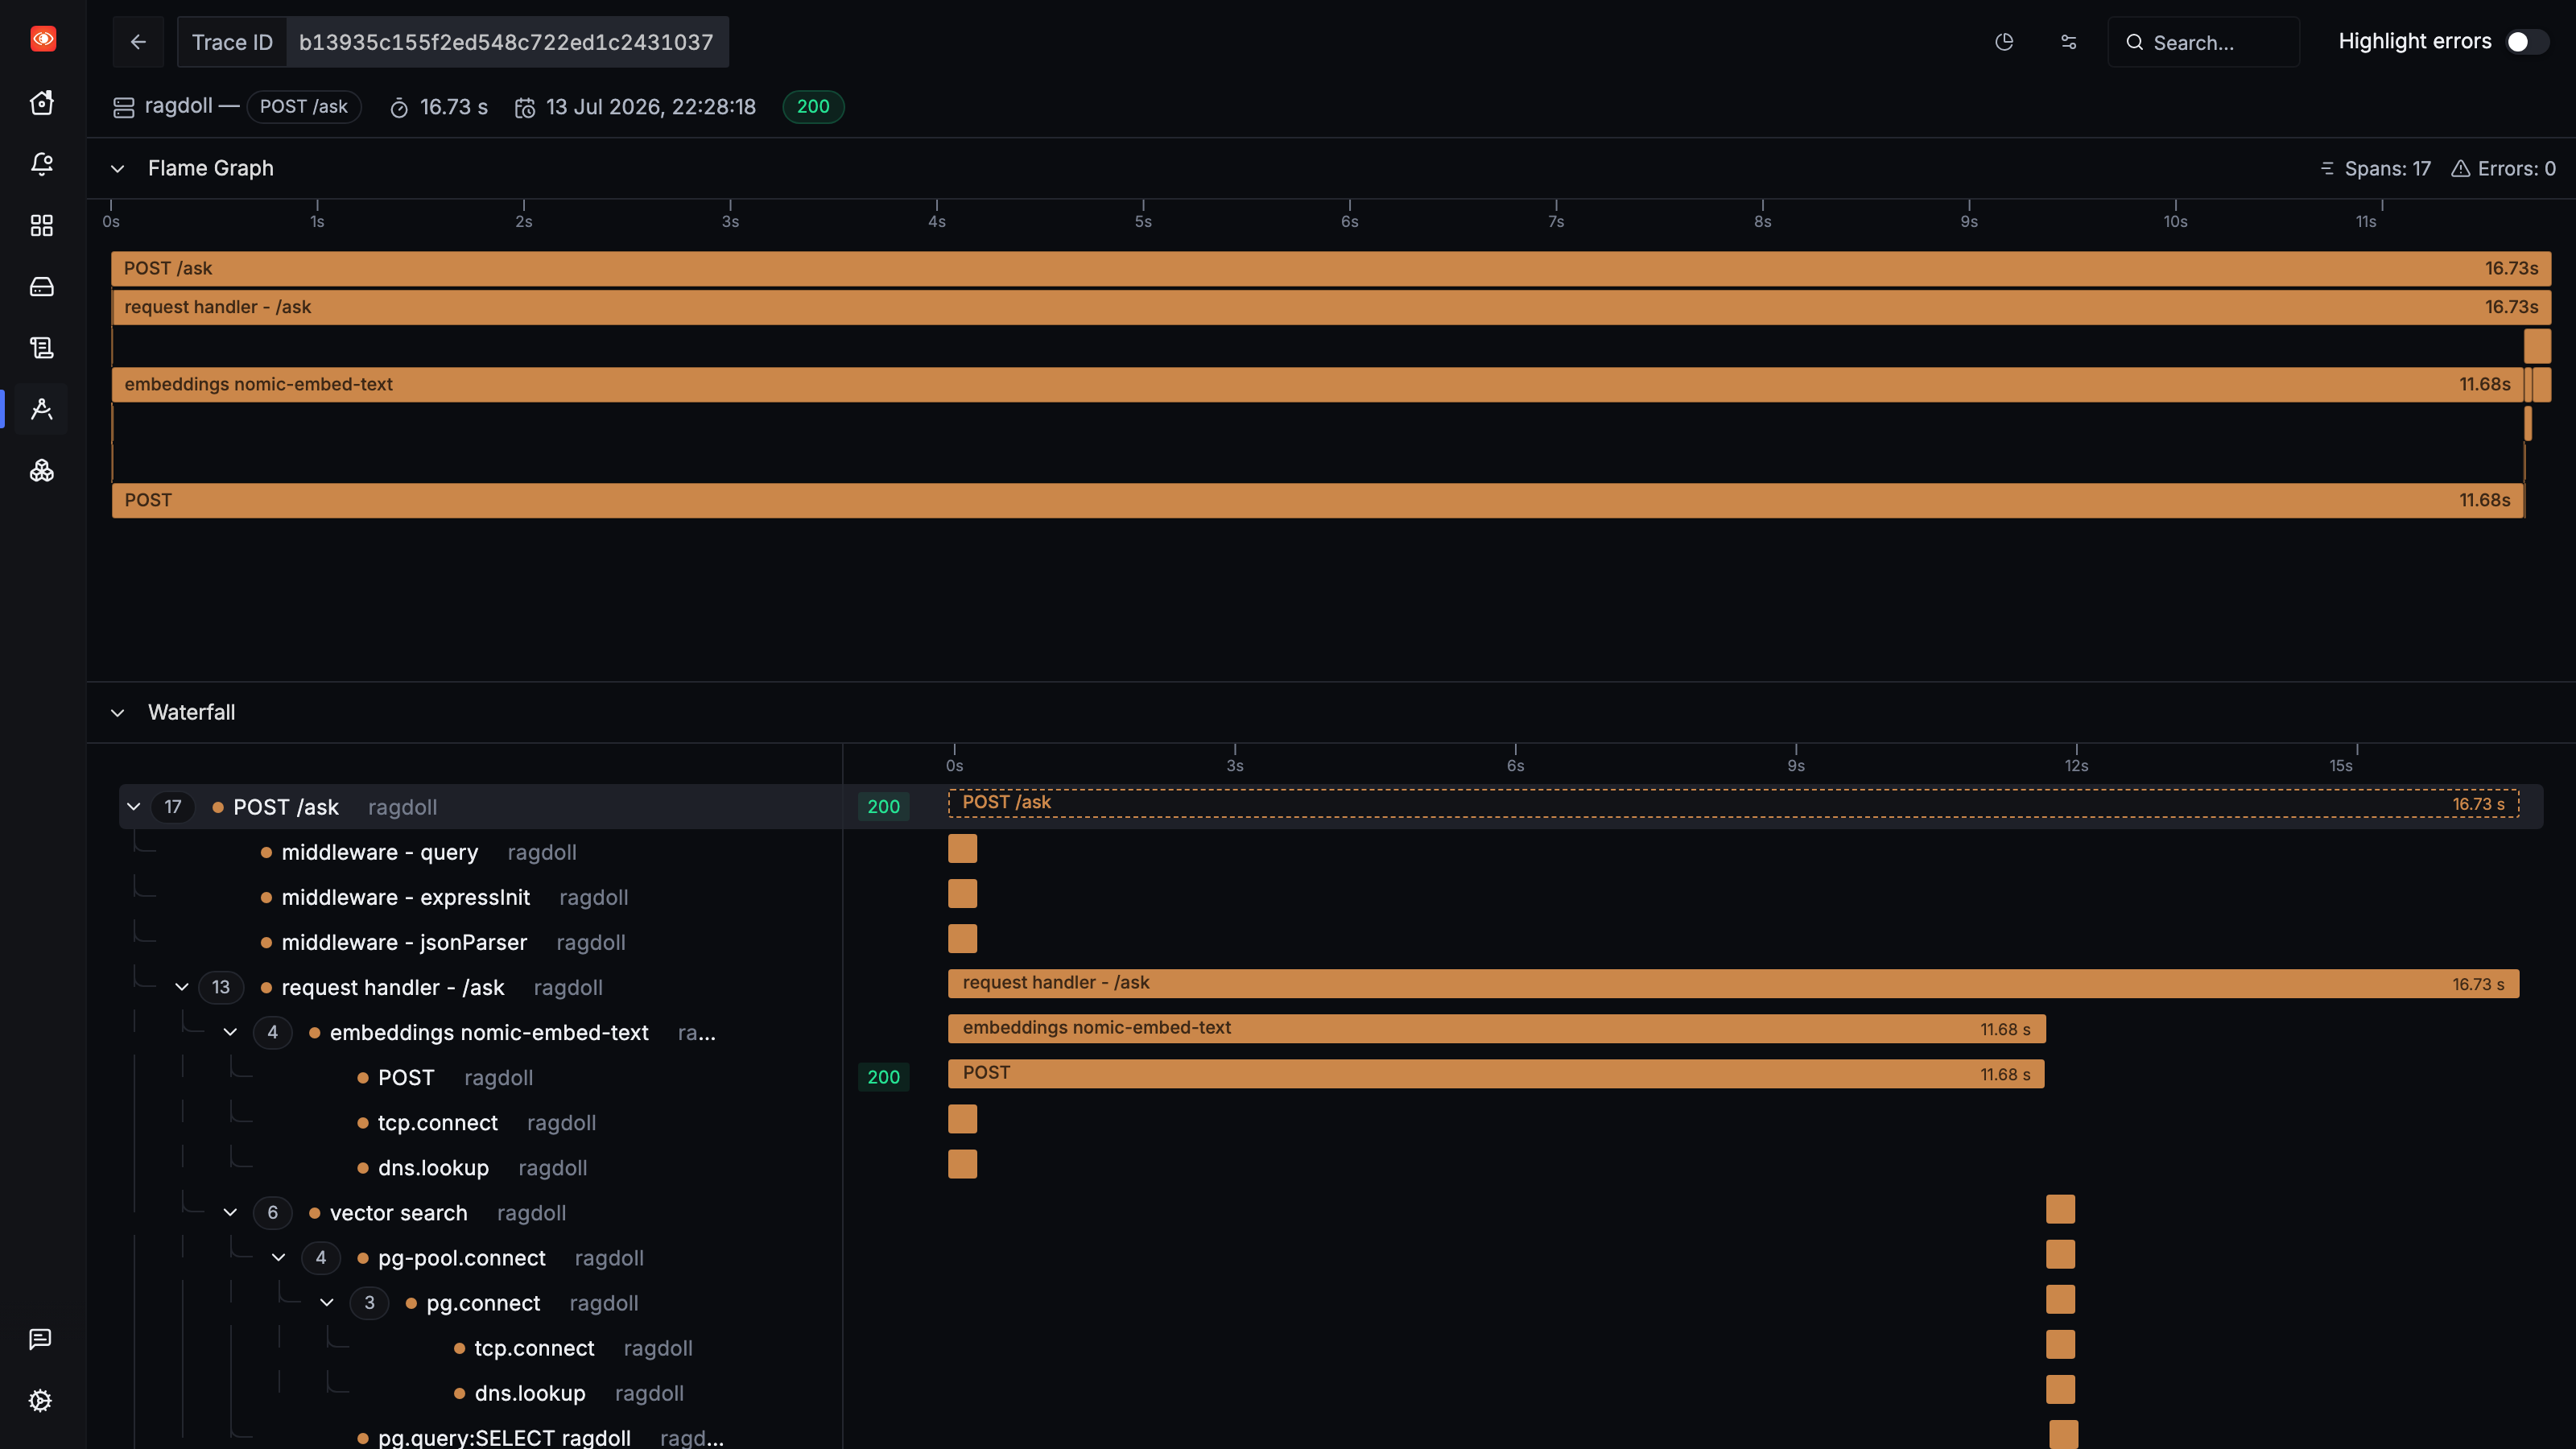
The chat span was blameless this time: 4.9 seconds, with a 202 ms load. The vector search over all 4,396 vectors, the component the entire industry warns you about, took 134 milliseconds on a sequential scan. Sitting above both of them: embeddings nomic-embed-text, batch size 1, embedding one ten-word question, 11.68 seconds. Seventy percent of the request went to the smallest model in the building.
Ollama's server log explained the rest. Loading llama3.2 for the first answer had evicted the embedding model. My two models were playing musical chairs on one GPU: each request for one shoved out the other, and the reload ran while llama was busy generating, so a 274 MB model took 11.5 seconds to come back. The log line 'loaded runners count=2' lands at the exact millisecond the slow span ends. I checked twice.
This is the SigNoz feature that earned its keep for me: the trace detail view puts the flame graph, the waterfall and every span's attributes on one screen. My gen_ai spans sit in the same tree as pg.query and tcp.connect, and that adjacency is exactly where the answer lived.
The fix cost two lines and a warmup
// keep_alive: -1 on both Ollama calls: never unload.
// And at boot, pay the model-load tax before users do:
app.listen(3210, async () => {
  await embed(["warmup"]);   // loads nomic-embed-text
  await generate("Say ok."); // loads llama3.2:3b
});
I restarted everything to simulate a fresh deploy and re-ran the load test. p95, the time your unluckiest one-in-twenty request takes, went from 9.0 to 7.7 seconds. Median question-embedding time went from 653 ms to 116. The first user request after a deploy dropped from 7.7 to 5.1 seconds, because the loads now happen at boot inside their own 'warmup models' span where I can watch them. And a detail I enjoyed far too much: the warmup loads nomic in 542 ms on an idle GPU. The identical load cost 11.5 seconds when it raced the chat model for memory. Contention was the multiplier, not disk.
Making the bug page me next time
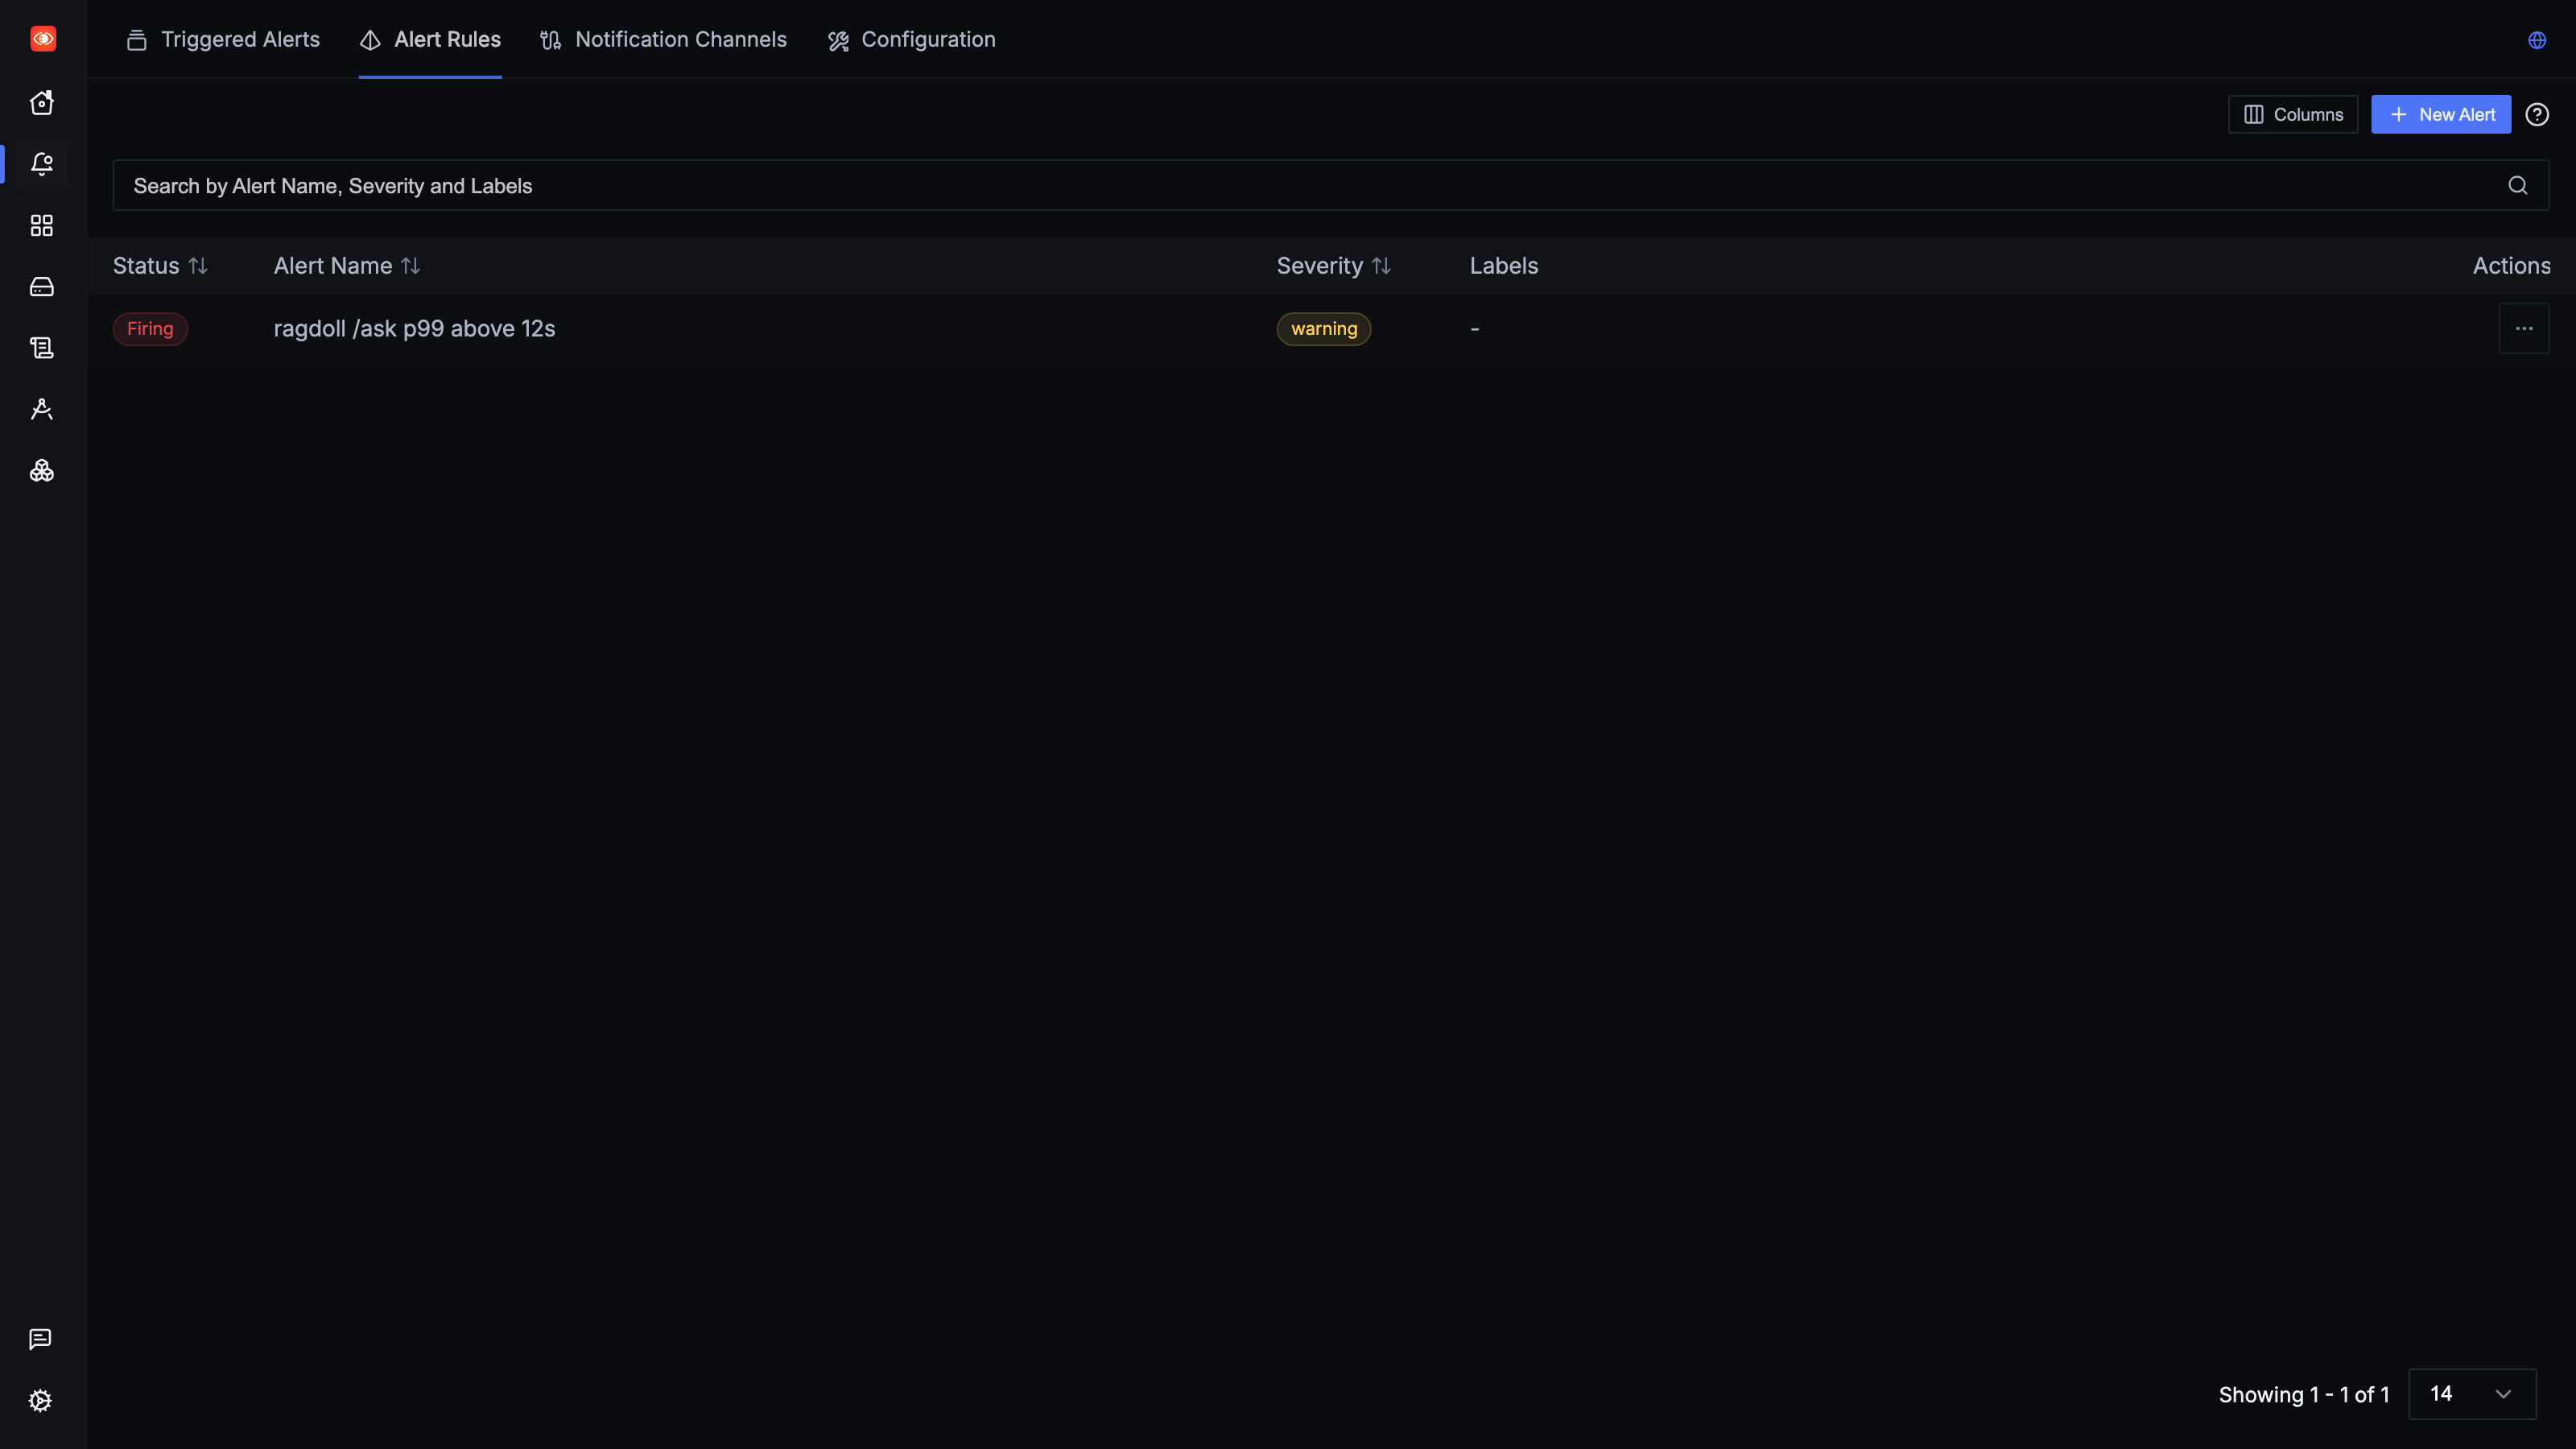
This failure mode returns any time Ollama restarts under an app that is already warm, say after a brew upgrade. So I made SigNoz watch for it: a traces-based alert on p99 of POST /ask above 12 seconds over 5 minutes, wired to a webhook. Then I reproduced the regression on purpose, restarting Ollama mid-traffic without restarting the app. Six minutes later my terminal listener printed this:
{
  "status": "firing",
  "labels": {
    "alertname": "ragdoll /ask p99 above 12s",
    "severity": "warning"
  },
  "annotations": {
    "summary": "RAG answers are crawling. p99 of POST /ask
                exceeded 12s over the last 5 minutes.",
    "related_traces": "http://localhost:8080/traces-explorer?..."
  },
  "startsAt": "2026-07-13T17:13:02Z"
}
My favorite part is that related_traces link SigNoz packs into the payload. The page that wakes you up links straight to the traces that caused it. Small thing, correct priorities.
A dashboard with an eviction detector
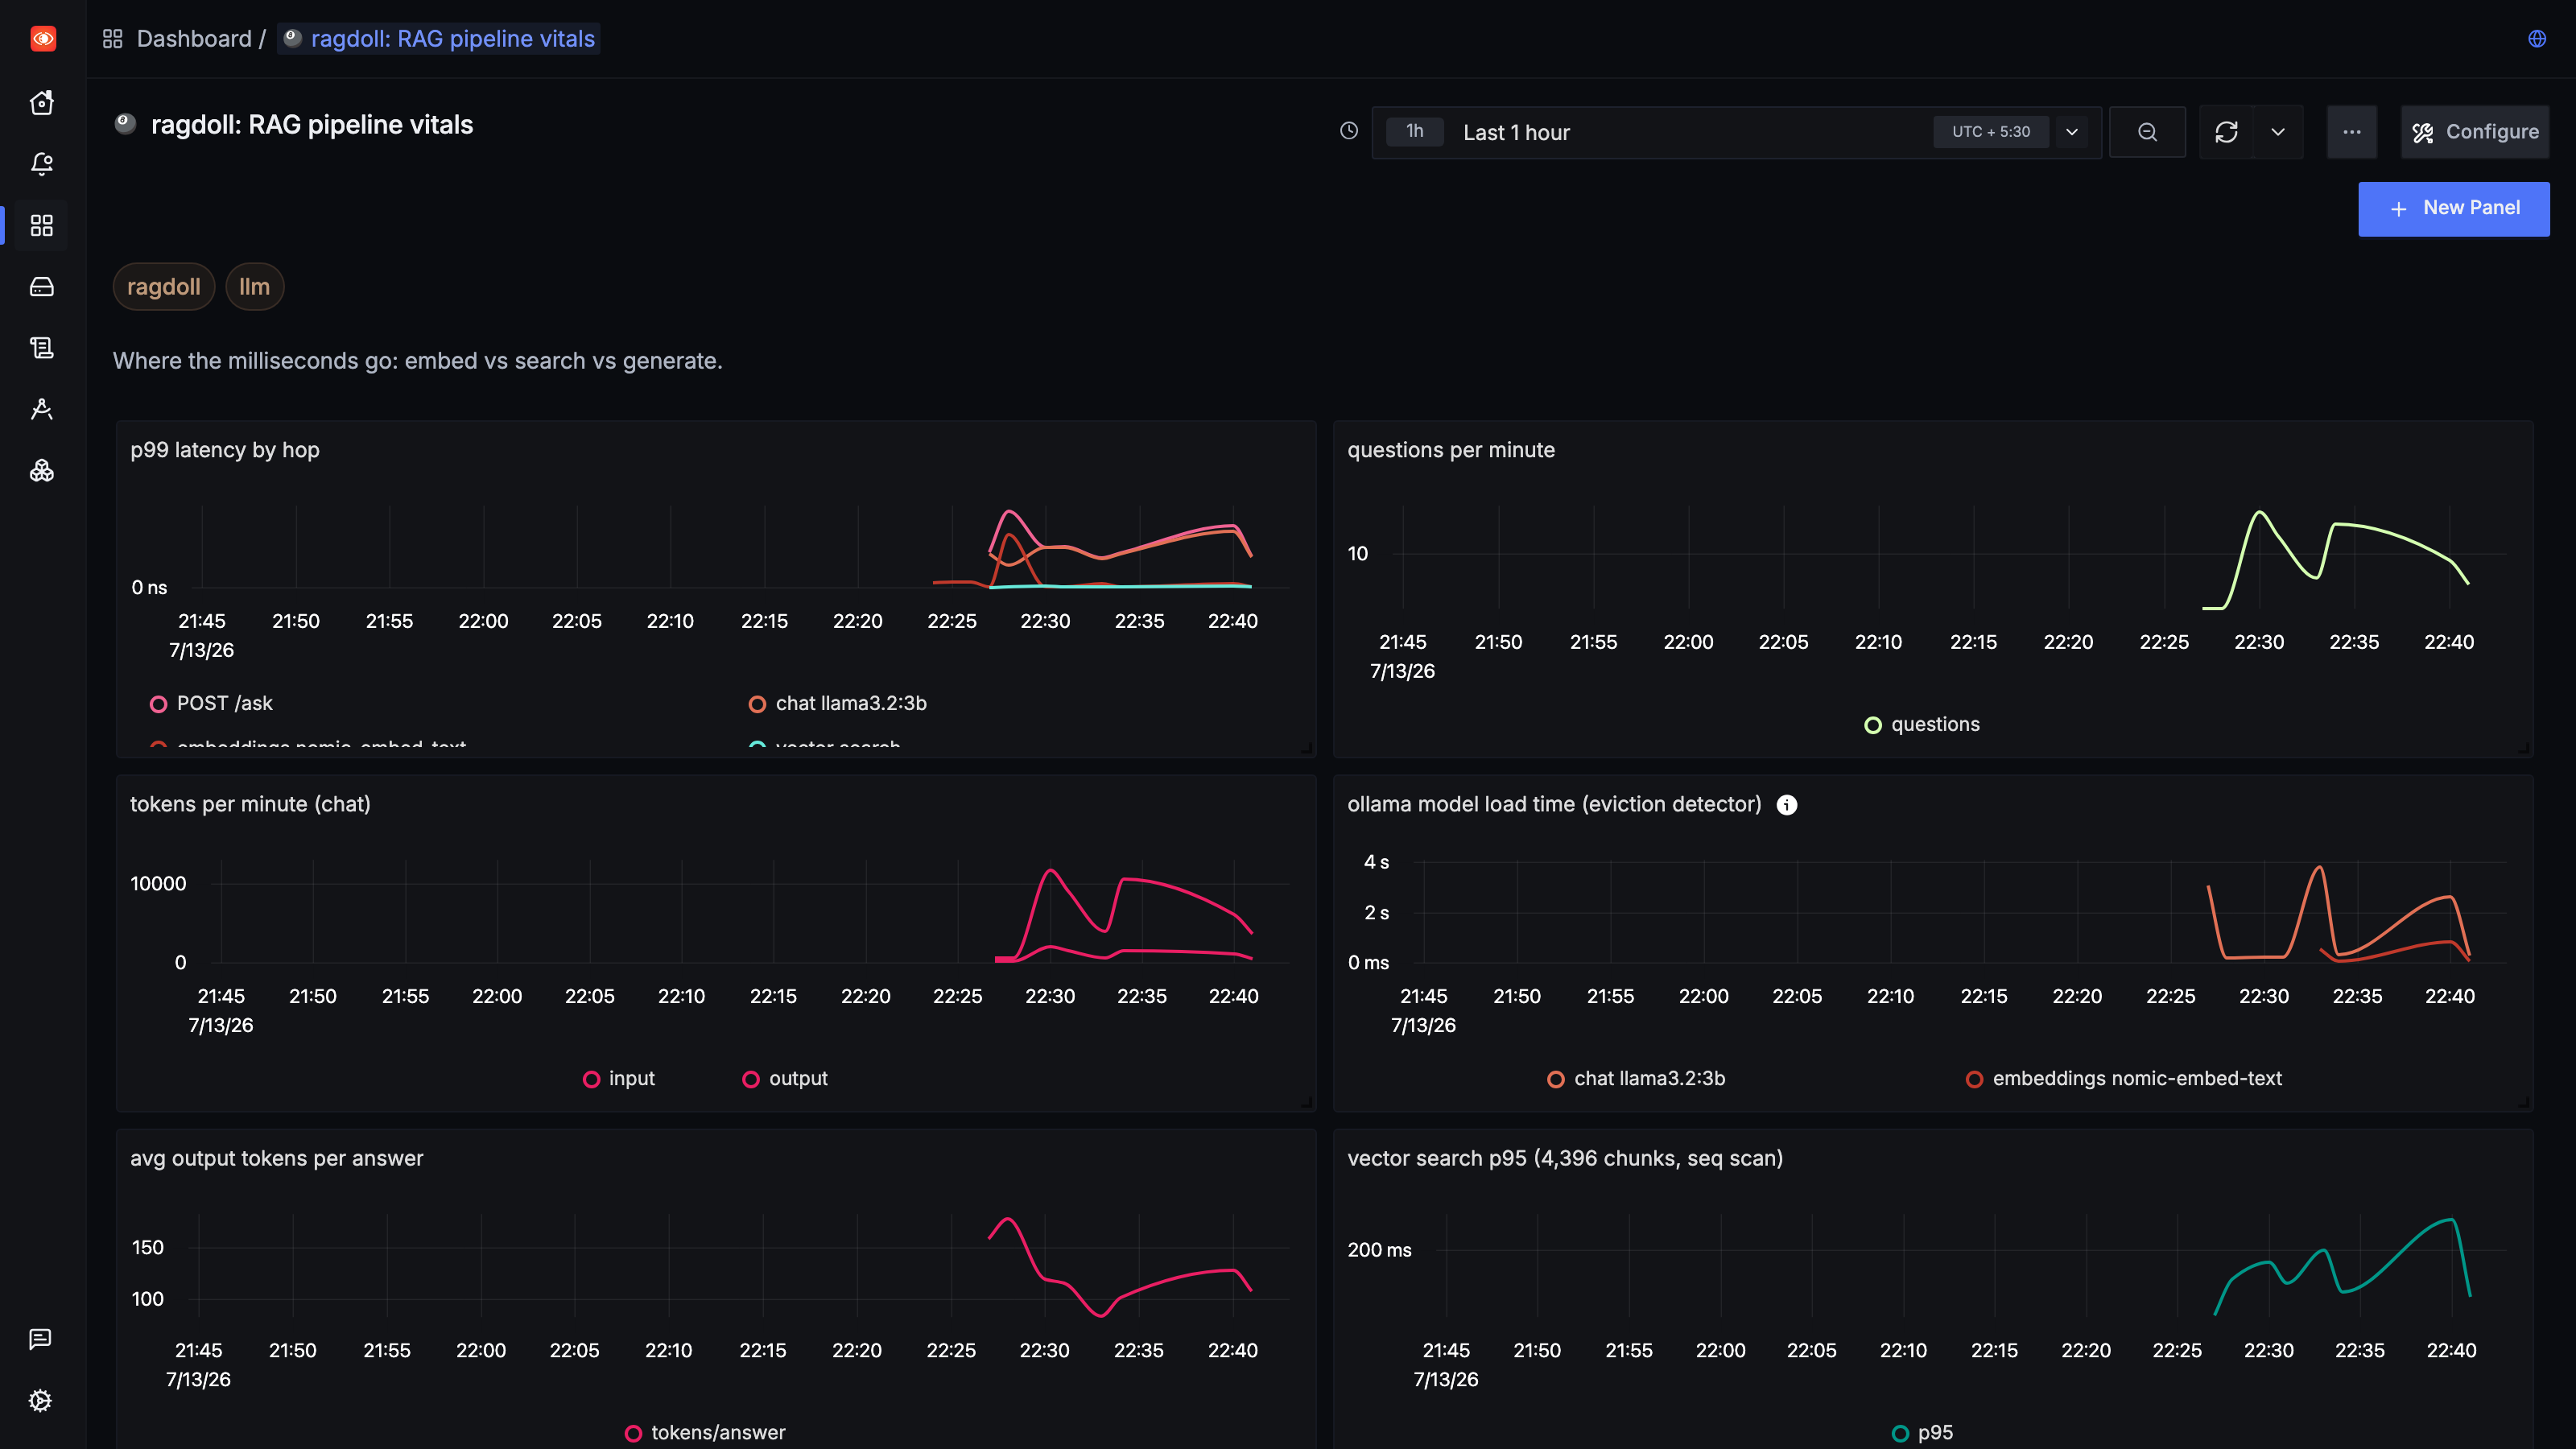
Six panels, created by POSTing JSON at the dashboards API rather than clicking: p99 per hop, questions per minute, token throughput, average output tokens per answer, vector search p95, and my favorite, max(ollama.load_duration_ms) as a standing eviction detector. In steady state it flatlines at zero. Any bump means a user request just paid a model load, and it shows up before p99 even reacts. It queries a span attribute directly, no pre-aggregation, which quietly means every custom number you attach to a span is one query away from being a panel or an alert.
What I'd tell you over chai
- An LLM app is just software. Put its spans in the same waterfall as your database and your HTTP calls, because the bug lives in the gaps between them.
- Attach your inference server's self-reported timings to spans. load vs prompt_eval vs eval turns 'the model felt slow' into three numbers with names.
- The component with the scariest reputation, the vector search, never crossed 315 ms all day. Measure before you shard.
- Pay model loads at deploy time. keep_alive plus a warmup span is boring, and it works.
- Worked for my setup: one M1 Pro, 3B-class models, 4,396 chunks. Your evictions will differ. The method transfers, the numbers won't.
Total damage: SigNoz self-hosted in a minute, one real bug found by reading a waterfall, fixed with two lines, and an alert that now catches it for me. If you want to reproduce it, start at signoz.io/docs/install/docker and bring any pipeline you actually care about. Mine just happened to be reading its own documentation.
Update, August 2026: the same waterfall logic, four hops up the stack
GitHub's writeup on its August 17 outage is the same kind of trace, just with a much bigger blast radius than an 11-second embedding call. The chain runs: an Istio sidecar hits its concurrency limit, an auto-scaling policy that was watching the host and not the sidecar never fires, four HAProxy load balancers exhaust their flow limits, and the shared authentication path degrades globally. My ragdoll bug and GitHub's outage have the identical failure geometry: a shared dependency sitting a few hops below the surface, invisible to whoever's only watching the top-level metric.
The one-line eviction detector on my dashboard exists for exactly this reason: watch the internal component nobody else is watching, not just the request that fronts it. GitHub's fix is the infrastructure-scale version, auditing every auto-scaling policy to account for sidecar and mesh limits, not just the host they sit on. Same instinct, different zip code. If the component with the scariest reputation never crossed 315ms in my trace, the component nobody suspected is usually where the real story is.
More Posts
The sidecar GitHub's auto-scaler didn't know existed
On August 17, GitHub was down for 7 hours and 47 minutes. Not a bad deploy, not a bad config push. A scaling policy that watched the host and never checked the pod sitting next to it, and a client that turned a slowdown into a self-inflicted DDoS.
A query that returned nothing nested inside it
The exact same logical query returned full nested data through the REST layer and empty shells through the service layer underneath it. Same fields requested. Same backend. One shorthand parameter that only one of the two actually understood.
One field, three different envelopes, and a fix that made it worse
The same subscription-status field came back nested two levels deep, one level deep, or bare at the top, depending on account state. My fix didn't catch that. It added math on top of a check that was already wrong.